A cartogram, which is sometimes referred to as an isodemographic map, presents numeric information while maintaining some degree of geographic accuracy. For example, here is a map of the world: (click on each image to view a larger version)

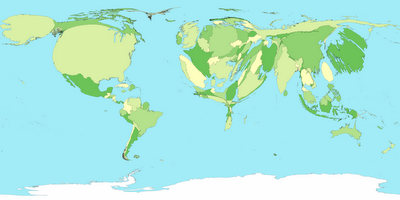
Here is a cartogram of the world, which uses each country's GDP to reflect disparity in wealth:
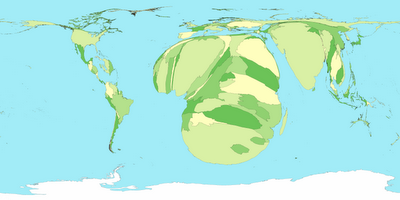
Here is a cartogram reflecting child/infant mortality rates:

Here is a cartogram reflecting relative energy consumption:

Finally, here is a cartogram reflecting HIV infection rates:
 Notice anything?

 Here is a cartogram of the world, which uses each country's GDP to reflect disparity in wealth:
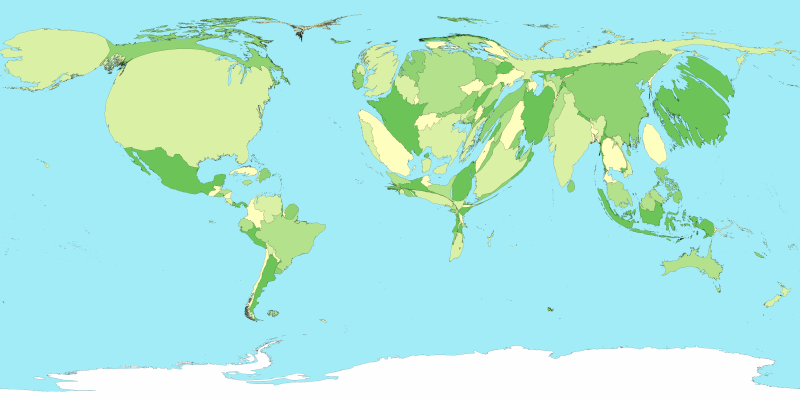 Here is a cartogram reflecting child/infant mortality rates:
 Here is a cartogram reflecting relative energy consumption:
 Finally, here is a cartogram reflecting HIV infection rates:
 Notice anything?
No comments:
Post a Comment